Trends Dashboard- Cement Performace Report with Power BI
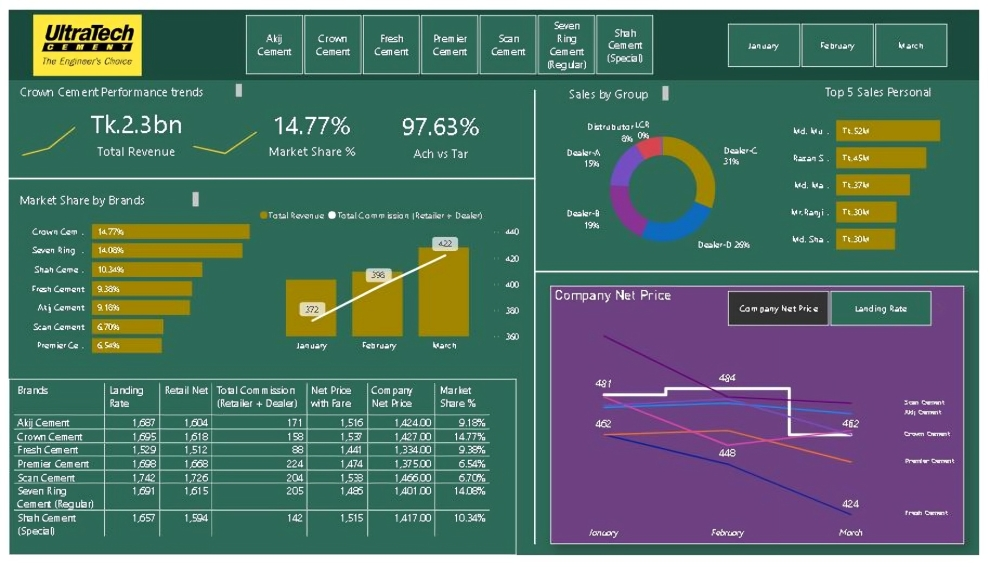
The performance trends of UltraTech Cement provide a comprehensive overview of its financial health and market position. The analysis covers total revenue, market share, and achievement against targets, offering insights into monthly performance variations. It evaluates sales effectiveness through group, distributor, and dealer channels, while highlighting the contribution of top sales personnel. By examining company and landing rates along with market share percentages, the trends reveal pricing and market dynamics. Additionally, revenue sensitivity analysis helps in understanding the impact of various factors on overall revenue, guiding strategic decisions for sustained growth and competitiveness.
Take Care Dashboard- Take Care Performance Report with Power BI
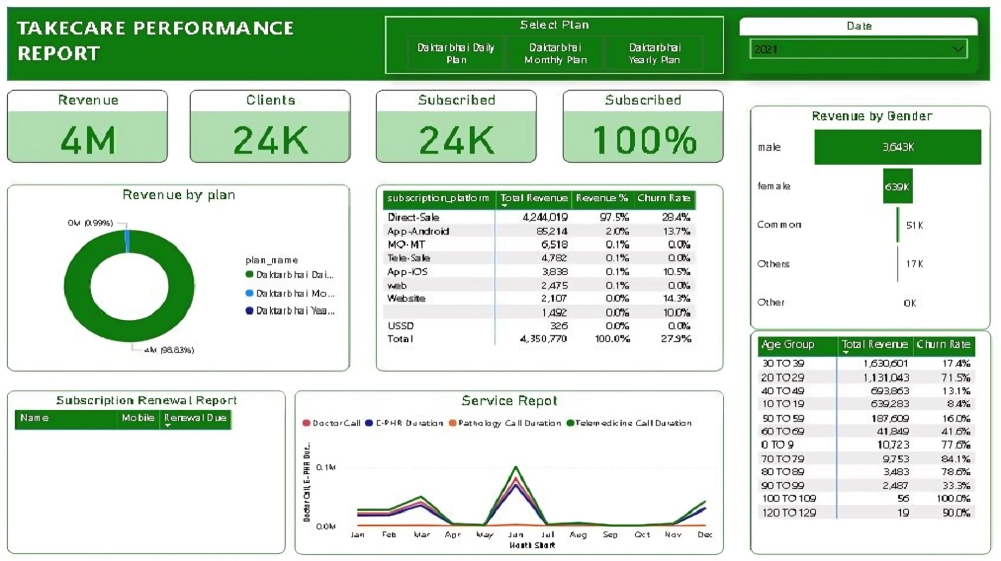
This comprehensive “TakeCare” performance report enables an in-depth understanding of operational efficiency, financial health, client demographics, and service utilization, guiding strategic decisions and enhancing service quality. This report is further divided into sections for a detailed metric analysis. By analyzing this report, you can gain valuable insights into Dr. Bhai’s performance, identify areas for improvement, and make data-driven decisions to optimize client acquisition, service delivery, and overall business strategy.
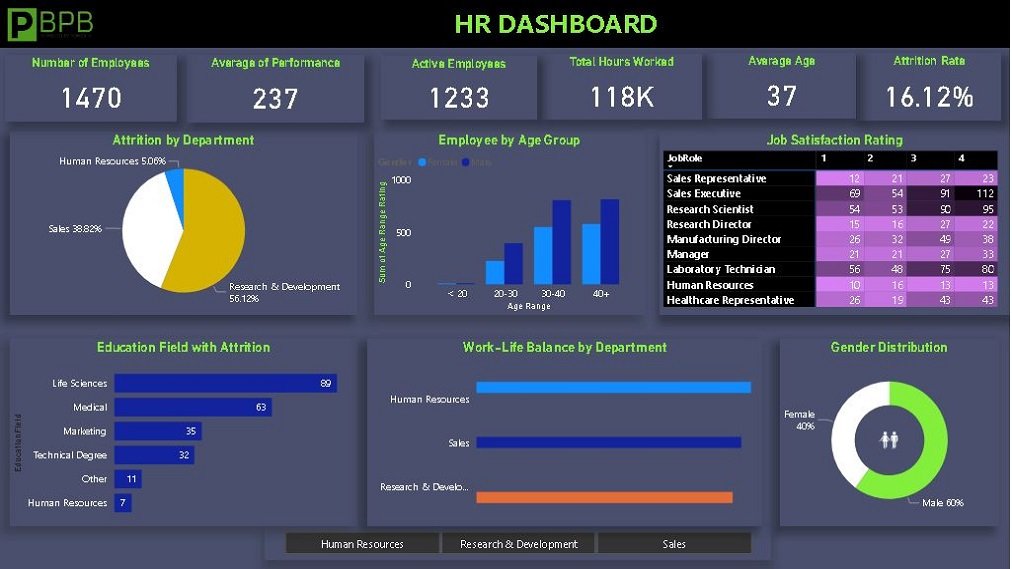
HR Dashboard: Optimizing HR Resources with Power BI
Power BI templates enhance revenue management for educational courses and subjects by calculating average revenue per course. This insight identifies high-performing areas and optimizes offerings. By categorizing study groups based on duration (e.g., less than 1 year, more than 2 years), these templates analyze price changes over time, crucial for strategic pricing decisions. Additionally, registration monitoring tracks trends by level, providing a clear view of demand and popularity. This data is essential for adjusting marketing strategies and resource allocation efficiently.
Sales Dashboard: Optimizing Course Revenue with Power BI

Power BI templates enhance revenue management for educational courses and subjects by calculating average revenue per course. This insight identifies high-performing areas and optimizes offerings. By categorizing study groups based on duration (e.g., less than 1 year, more than 2 years), these templates analyze price changes over time, crucial for strategic pricing decisions. Additionally, registration monitoring tracks trends by level, providing a clear view of demand and popularity. This data is essential for adjusting marketing strategies and resource allocation efficiently.

Tech Services Project Management Dashboard: Enhancing Efficiency in High-Tech Industries
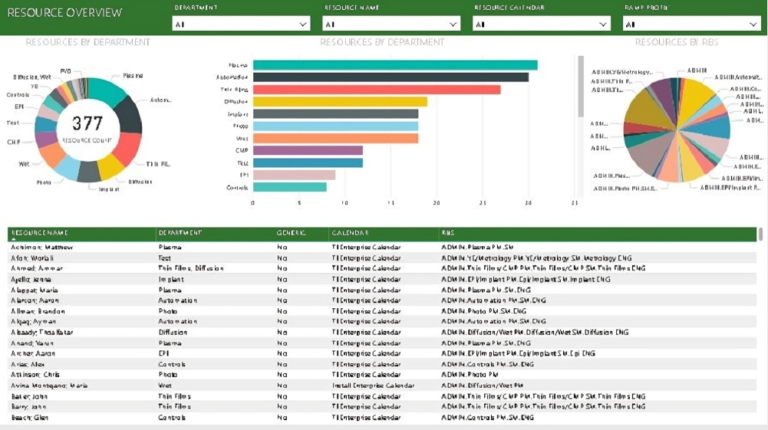
The Power BI project focuses on Technical Services Project Management, specifically designed to enhance visibility and control across complex technical services within high-tech industries like semiconductor manufacturing. The dashboard aggregates real-time equipment installation, testing, maintenance, and process optimization data. Key features include interactive Gantt charts, real-time performance metrics, and predictive maintenance alerts, empowering managers to make informed decisions and efficiently allocate resources.
Click here to See the Dashboard
Asset Pipeline Optimization: Leveraging Power BI for Streamlined Workflow Management
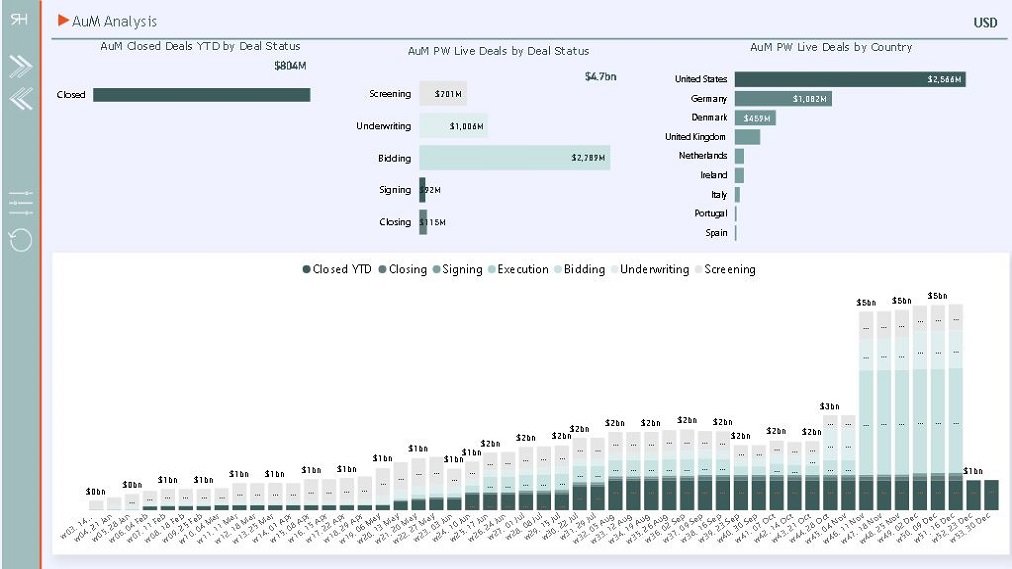
The Power BI project is centered on Asset Pipeline Management, designed to streamline tracking and optimizing asset workflows in industries requiring high capital investments like oil, gas, and utilities. The dashboard visualizes asset lifecycles, from procurement through retirement, with detailed performance analytics. It features maintenance schedules, depreciation calculations, and operational efficiency metrics. Interactive charts and alerts help managers minimize downtime, optimize asset utilization, and plan future investments effectively.