
For years, Business Intelligence has been about visualizing past performance. Dashboards showed us what happened yesterday, last month, or last year. While useful, this was largely a reactive approach. Today, with the integration of Artificial Intelligence (AI), the game has fundamentally changed. BI is no longer just about looking in the rearview mirror; it’s about predicting the road ahead.

Microsoft Power BI has been at the forefront of this revolution, embedding powerful AI capabilities directly into its platform. These features are transforming dashboards from static reports into dynamic, intelligent partners that uncover insights you didn’t even know to look for.
Key AI Features in Power BI You Should Be Using:
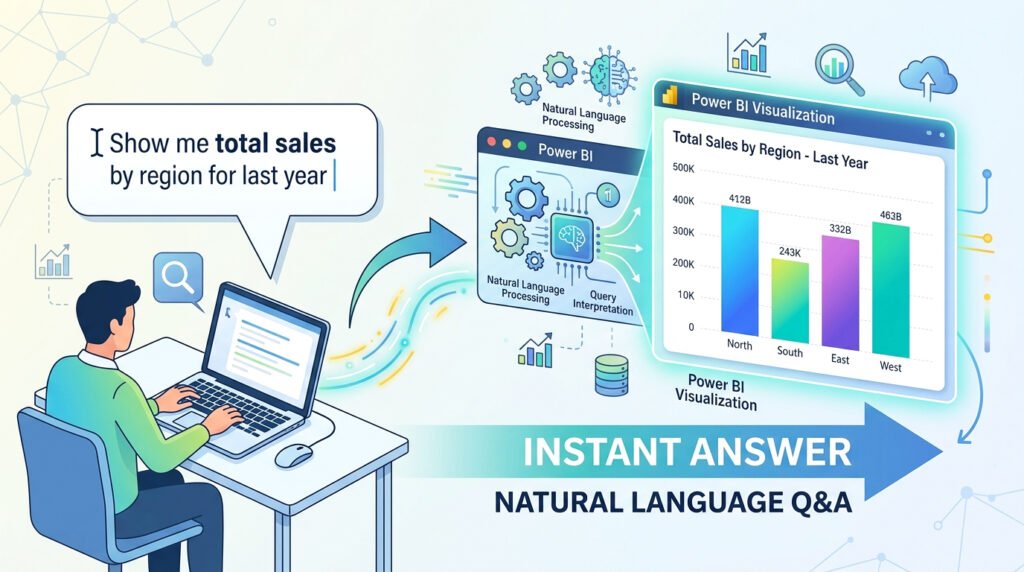
- Natural Language Q&A (Ask Questions, Get Answers):
Imagine being able to ask your data questions in plain English, just like you would ask a colleague. Power BI’s Q&A feature allows users to type “What were our total sales in the West region last quarter?” and instantly receive a corresponding visualization. This democratizes data analysis, making it accessible to everyone, not just trained analysts. It removes the barrier between questions and insights. - Quick Insights (Automated Data Analysis):
Sometimes, the most valuable insights are hidden in plain sight. Power BI’s “Quick Insights” feature uses machine learning algorithms to automatically analyze your dataset and search for hidden trends, correlations, outliers, and significant patterns. With a single click, it can generate a dozen or more visualizations highlighting interesting findings that you might have missed. This is an excellent starting point for deeper investigation. - Predictive Analytics & Forecasting:
This is where BI truly becomes forward-looking. Power BI’s analytics pane allows you to apply forecasting models to your time-series data. You can project future sales, predict inventory needs, or forecast website traffic with just a few clicks. This capability, once the domain of expert data scientists, is now accessible within your dashboard, enabling proactive, strategic planning. Our Custom Dashboard Development team specializes in building these predictive models. - AI Visuals (Decomposition Tree & Key Influencers):
Power BI includes specific visuals designed for root cause analysis.- Key Influencers Visual: This helps you understand the factors that drive a specific metric. For example, what are the top factors that influence a customer to churn? The visual analyzes your data and ranks the influencers for you.
- Decomposition Tree: This visual allows you to break down a metric and explore its constituent parts in a hierarchical way, making it easy to drill down and understand the “why” behind your numbers.
The integration of AI into Power BI is more than just a set of fancy features. It represents a paradigm shift in how we interact with data. It moves us from passive observation to active exploration and from reactive analysis to proactive strategy. For businesses looking to push the boundaries even further, our expert developers at Power Soft can build custom AI models that integrate directly with your BI environment.
Businesses that leverage these tools will be able to adapt faster, innovate smarter, and build a significant competitive advantage.
Is your business ready for intelligent analytics? Let our experts at Powered by Power BI show you how to unlock the power of AI in your data.