🚀 Why Learn Power BI?
Before jumping in, here’s why Power BI is worth learning:
- High demand: Power BI is one of the top requested BI tools in job listings.
- User-friendly: Clean interface and intuitive drag-and-drop functionality.
- Powerful analytics: Combine multiple data sources, create rich visuals, and build dashboards easily.
- Microsoft ecosystem: Seamless integration with Excel, SQL Server, Azure, and more.
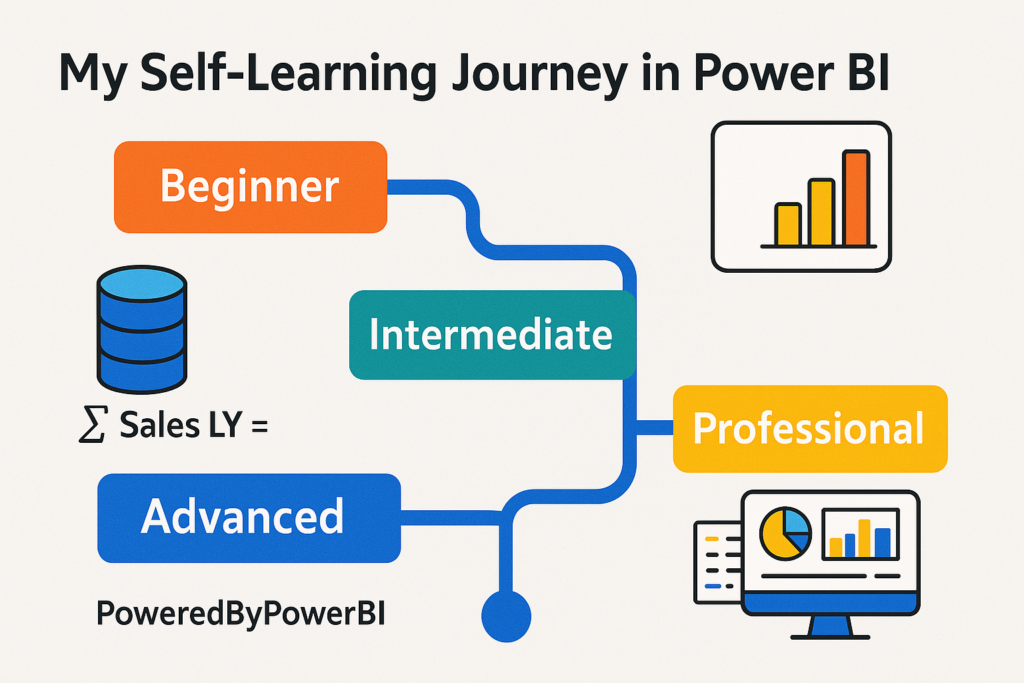
🗺️ Power BI Self-Learning Roadmap
To effectively self-learn Power BI, follow this roadmap divided into four stages:
✅ 1. Beginner Level: Understanding the Basics
🔹 What to Learn:
- What is Power BI?
- Power BI components: Desktop, Service, Mobile
- Getting started with Power BI Desktop
- Connecting to data sources (Excel, CSV, Web)
- Creating simple reports and visuals
- Publishing to Power BI Service
🔧 Tools:
- Power BI Desktop (Free download)
- A sample dataset (e.g., Superstore, Sales data)
🎓 Free Resources:
- Microsoft Learn: Power BI Learning Path
- YouTube channels:
- Guy in a Cube
- Learn with Pavan Lalwani
- Enterprise DNA
✅ Practice Task:
Connect an Excel sales file, create a bar chart showing sales by region, and publish the report to the Power BI service.
✅ 2. Intermediate Level: Diving Deeper into Data Modeling and DAX
🔹 What to Learn:
- Relationships and data modeling
- Star schema vs Snowflake schema
- Introduction to DAX (Data Analysis Expressions)
- Calculated columns vs Measures
- Common DAX functions:
SUM,CALCULATE,FILTER,RELATED,ALL
🧠 DAX Example:
Total Sales = SUM(Sales[SalesAmount])

Sales LY =
CALCULATE(
    [Total Sales],
    SAMEPERIODLASTYEAR(Dates[Date])
)
📚 Resources:
- DAX Guide: https://dax.guide
- SQLBI tutorials: https://www.sqlbi.com
✅ Practice Task:
Create a dashboard showing Total Sales, Sales vs Previous Year, and Top 5 Products.
✅ 3. Advanced Level: Dynamic Reports & Performance Optimization
🔹 What to Learn:
- Advanced DAX patterns
- Row-level security (RLS)
- Bookmarks, drillthroughs, and tooltips
- Parameterized reports
- Performance tuning and optimization
🧪 Advanced DAX:
Top Customers =
TOPN(
    5,
    ADDCOLUMNS(
        VALUES(Customers[CustomerName]),
        "TotalSales", [Total Sales]
    ),
    [Total Sales],
    DESC
)
📚 Advanced Learning:
- Marco Russo & Alberto Ferrari (Books and Blogs)
- Power BI community: https://community.powerbi.com
- YouTube: “Guy in a Cube – Advanced DAX” Playlist
✅ Practice Task:
Implement dynamic page navigation using buttons and bookmarks, add row-level security based on user roles.
✅ 4. Professional Level: Real Projects, Deployment, and Integration
🔹 What to Learn:
- Working with live/DirectQuery sources (SQL, Azure)
- Paginated reports
- Power BI REST API
- Power BI with Python/R
- Power BI governance and deployment pipelines
📁 Real-World Use Case:
Build a Sales Analytics Dashboard using live SQL data, implement RLS for sales agents, and deploy using a pipeline in Power BI Service.
📦 Git + Power BI:
Use .pbip project format for version control and collaboration:
init
git add .
git commit -m "Initial Power BI report"
🛠 Integration:
- Use Power Automate for scheduled refresh or alert-based actions
- Connect Power BI reports to SharePoint, Teams, or embedded in web apps
📌 Tips for Effective Self-Learning
- Set goals: e.g., “Create a dashboard within 2 weeks.”
- Practice regularly: Build a new report every week.
- Engage with community: Join Power BI LinkedIn groups, Reddit forums.
- Participate in challenges: Follow #WorkoutWednesday or Maven Analytics challenges.
- Document your learning: Start a blog or GitHub repo to showcase your dashboards.
💼 Build a Portfolio
If you’re looking to land a job or freelance as a Power BI developer, a portfolio is essential.
Ideas for Portfolio Projects:
- Sales & Profit dashboard
- Marketing campaign analytics
- Healthcare KPI tracker
- HR recruitment analysis
- E-commerce order performance
Host your dashboards on Power BI service and embed screenshots or links in your portfolio/GitHub.
🔚 Conclusion
Power BI is not just a reporting tool—it’s a gateway to understanding and communicating data effectively. By self-learning with a structured approach, you can quickly gain skills that are valuable across multiple industries.
📣 Final Advice:
Start small, be consistent, learn by doing, and never stop exploring!